Computerized Saddle Pressure Testing
Our mobile, computerized saddle fitting system has been developed to review the fit of your saddle and give horse owners and riders an accurate record of how a saddle fits their horse. This new computer technology provides color imaging of the saddle area, highlighting contact and pressure points. It is wireless and works up to about 300 meters.
Besides helping with saddle fit issues pressure scanning can also be helpful to analyze the rider’s seat:
- How the horse feels the rider’s weight; what happens in half passes, shoulder ins and 10 m circles.
- What does the horse feel if the rider is sitting crooked or is in a chair seat?
The unique combination of the wireless saddle pressure scan with the simultaneous video recording of the rider will provide a valuable idea of the pressure distribution of the saddle. It will also show what the rider is doing during certain movements and the resulting horse’s reaction.
The Pressure Saddle Pad
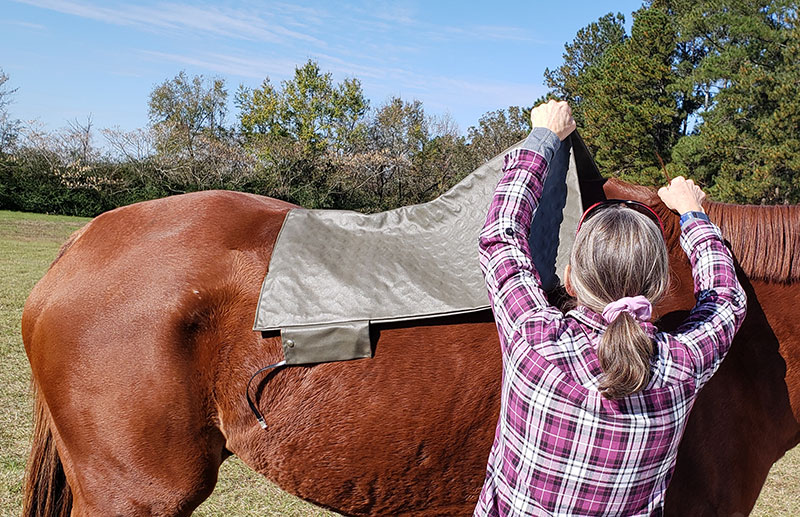
The pressure pad consists of 256 thin sensors which are sewn into a textile like material. The scan is done with all the saddles pads the rider usually puts under the saddle (half pads, cotton pads etc) since it is important to see how the saddle scans with all pads in place. The pressure sensor pad is contoured and therefore conforms to the horse’s back with generous wither clearance. Any false readings can therefore be eliminated.
The horse needs to be warmed up before the pressure scan is done. It is important to perform the scan in the horse’s usual (relaxed) working frame since the saddle has to fit then.
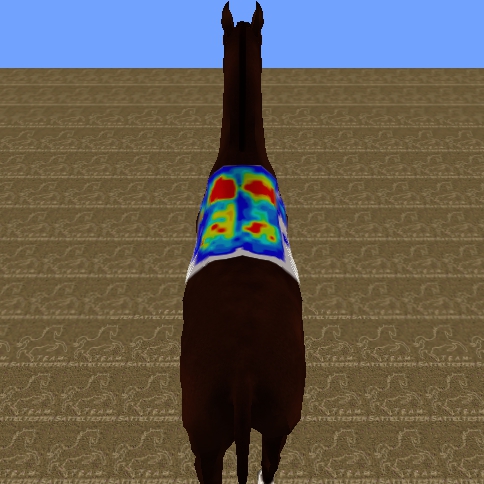
Whether or not a saddle is painful for the horse depends where it is experiencing too much pressure. Pinpoint pressure (areas displayed in ‘red’) creates more of a problem than absolute pressure under a saddle. A good and even pressure distribution of the saddle on the horse’s back is therefore of the utmost importance.
The in motion pressure scan lasts about 1 minute. After the data has been recorded the computer will calculate the average pressure of each individual sensor during this particular ride. A graphic image is displayed with various different colors.
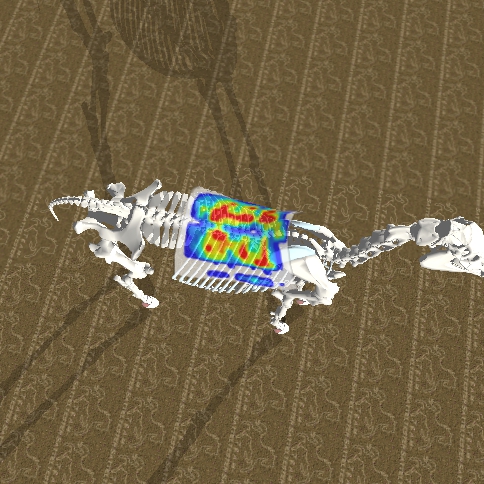
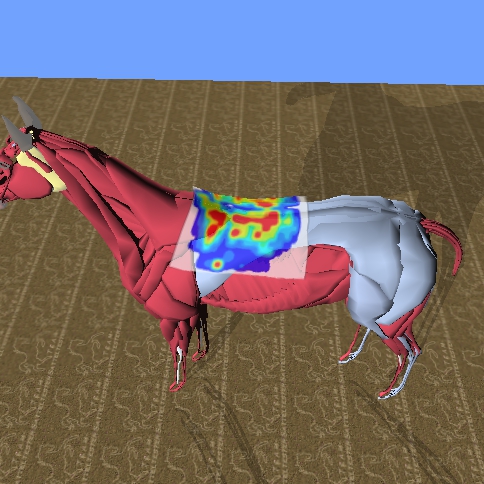
We can then also display various anatomical features. Before starting the pressure scan various data is measured on every individual horse and is entered into the computer:
- Placement of the pressure pad
- Highest point of the wither
- Insertion point of the trapezius muscle
- Last rib / T18